Phi-X, the Bio-φhotonics and Xomputational Imaging Laboratory at Istanbul Medipol University
We image living cells by how much they slow down light.
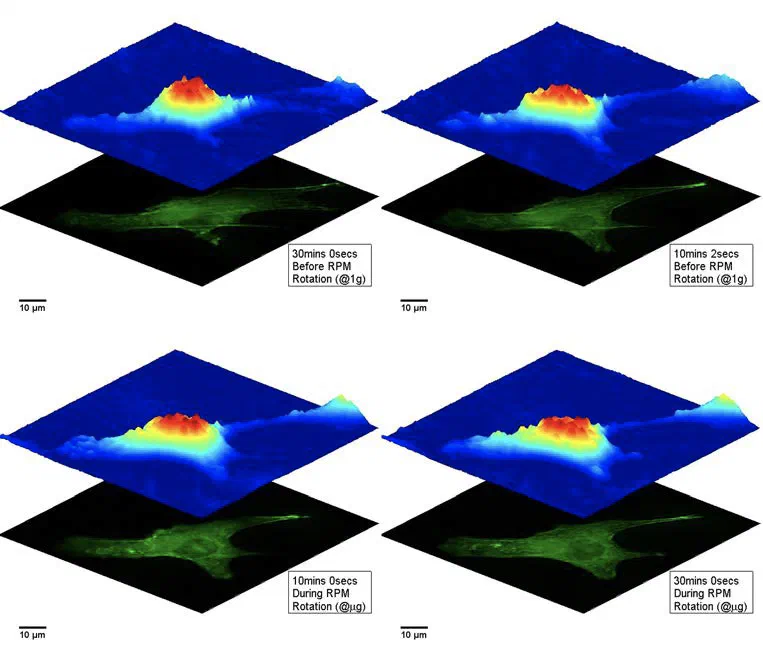
Our microscopes measure the optical phase delay at every pixel. Transparent, unstained cells and tissue become quantitative maps of thickness, refractive index and birefringence, in 2D, in 3D and over time.
Drag across the image. On the right is the interference pattern a camera records; on the left, the phase map we compute from it. Simulated cells, 632.8 nm illumination.
We build label-free microscopes and the computation behind them: holographic instruments, reconstruction algorithms, and optical systems that do part of the processing in light itself.
A transparent cell barely changes how bright light is, but it does delay it. Off-axis digital holographic microscopy records that delay as interference fringes and turns it into a phase map sensitive to nanometre changes in optical thickness.
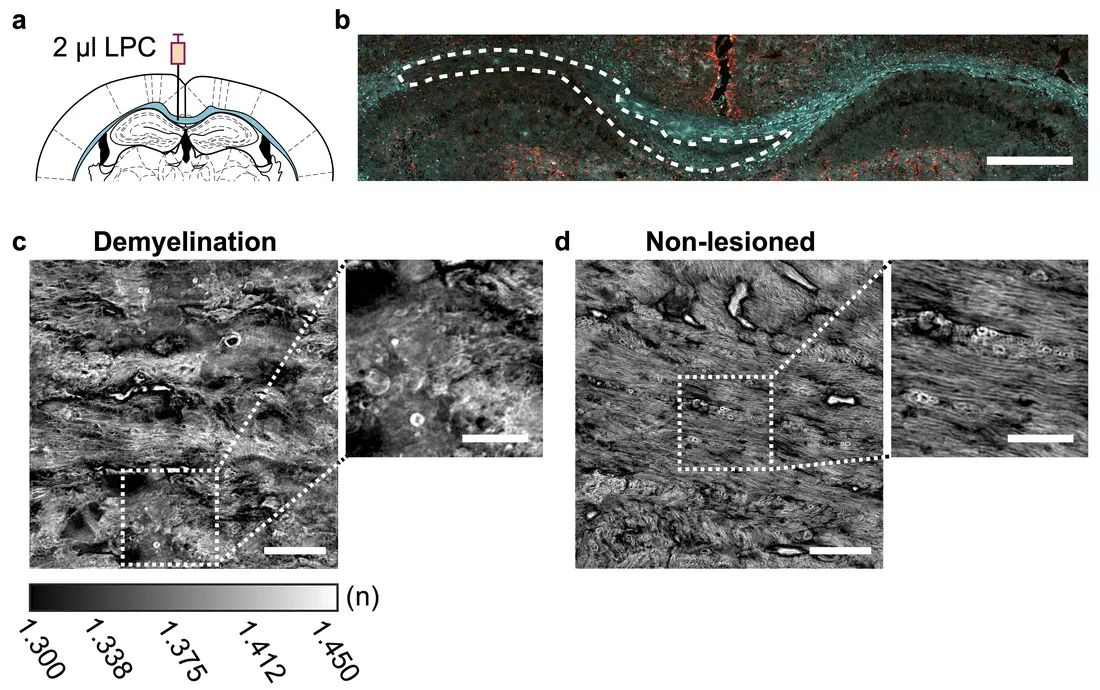
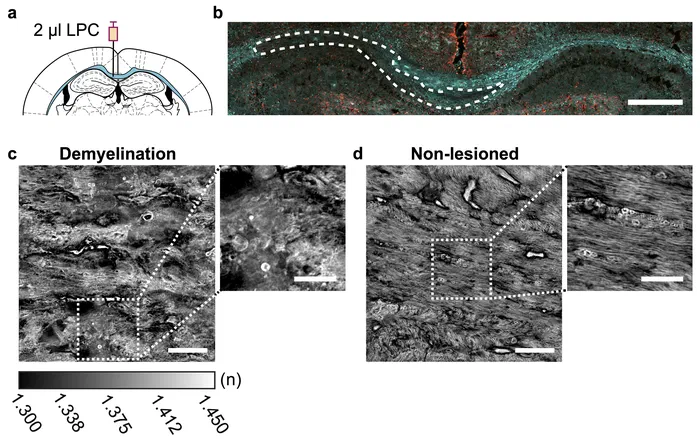
Recording holograms from many illumination angles lets us reconstruct the 3D refractive index of a specimen, from nanoscale structures in living neurons to myelin in brain tissue, without any stain.
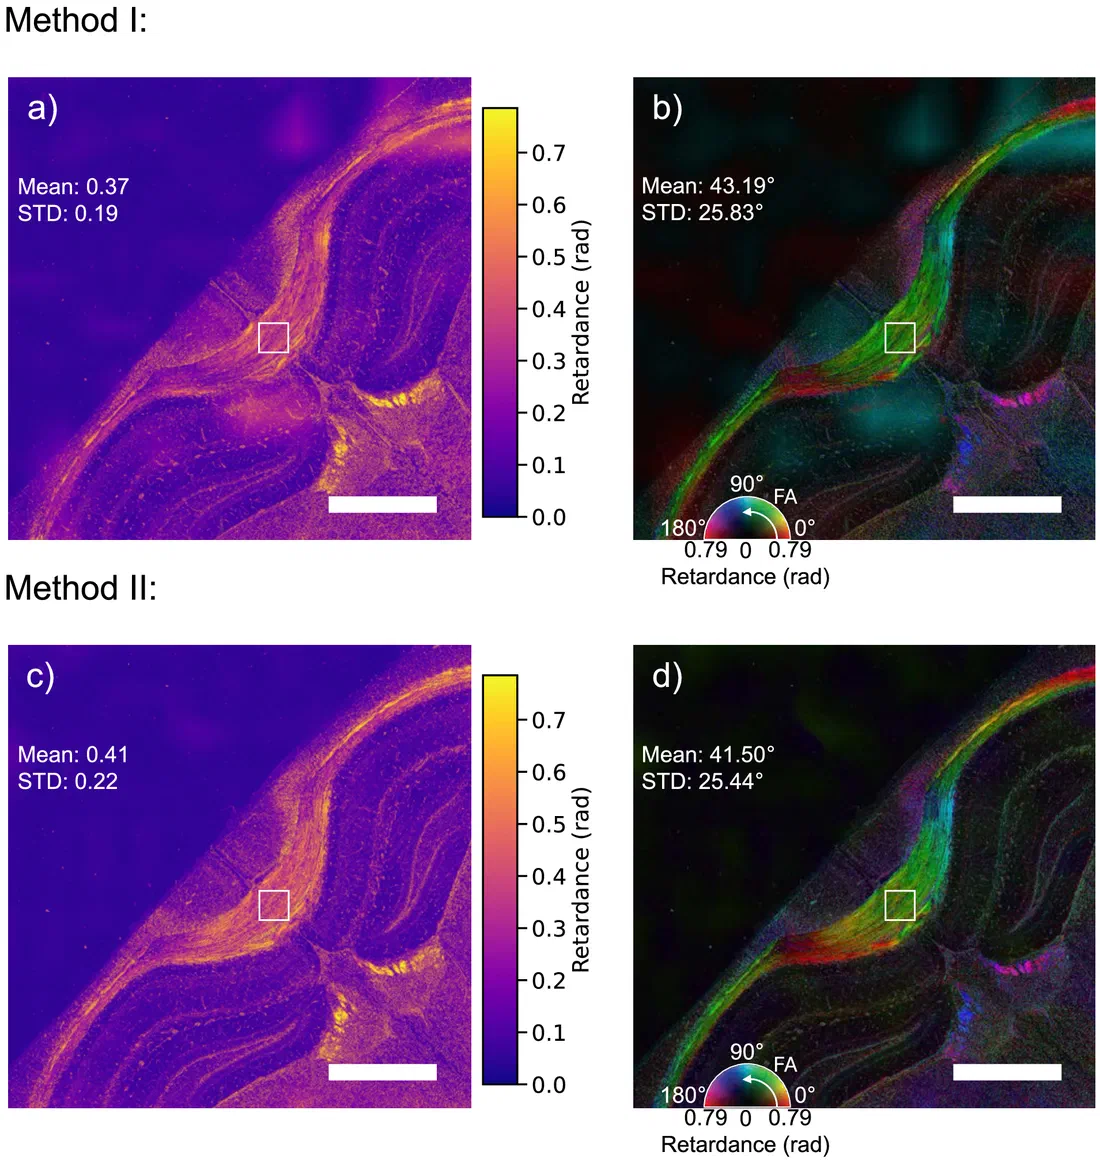
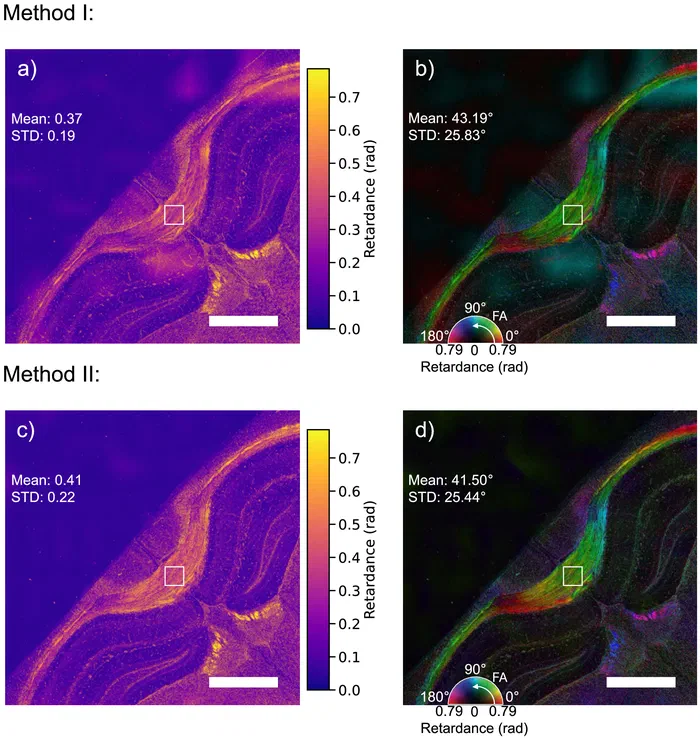
Many biological structures, from collagen to myelin, are birefringent. Our polarization holographic microscope recovers the full Jones matrix of a sample from two camera exposures, giving maps of retardance and fast-axis orientation.
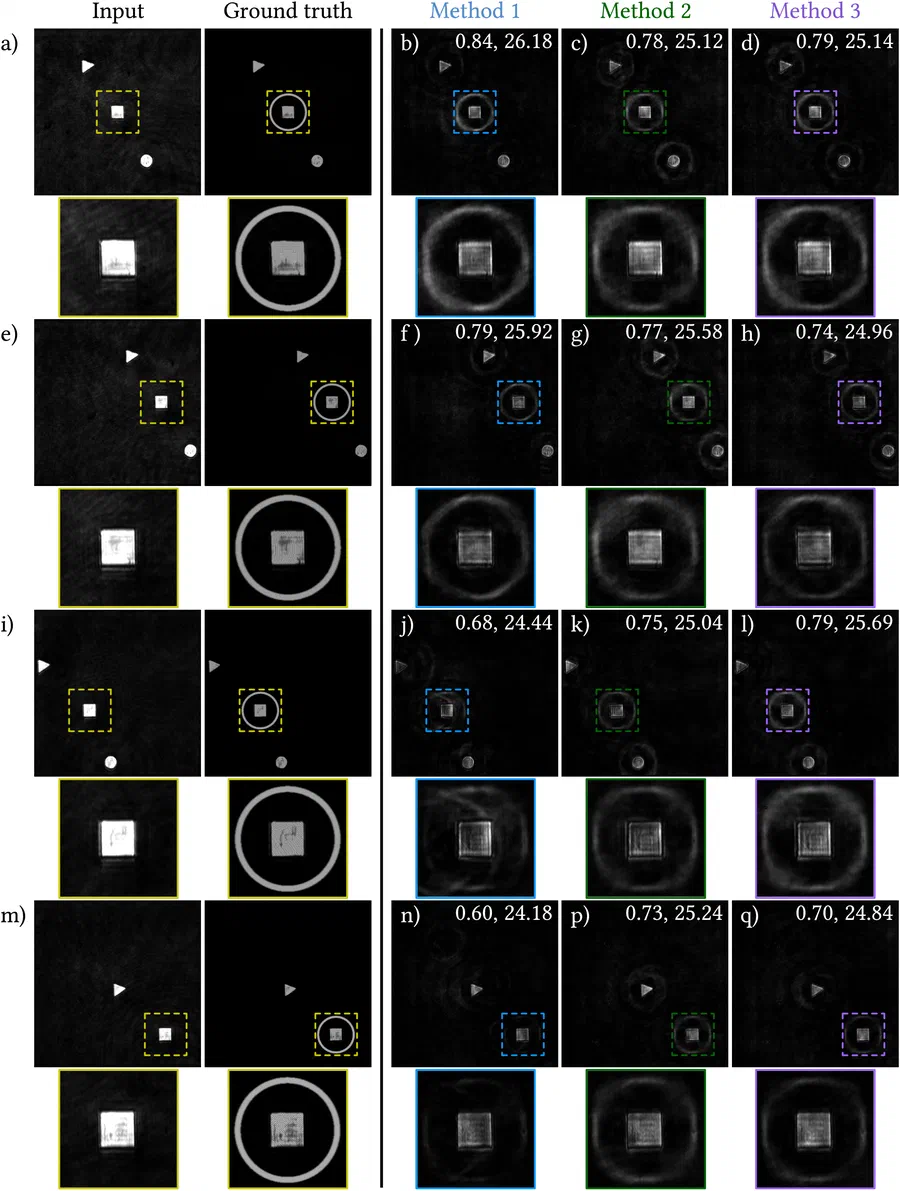
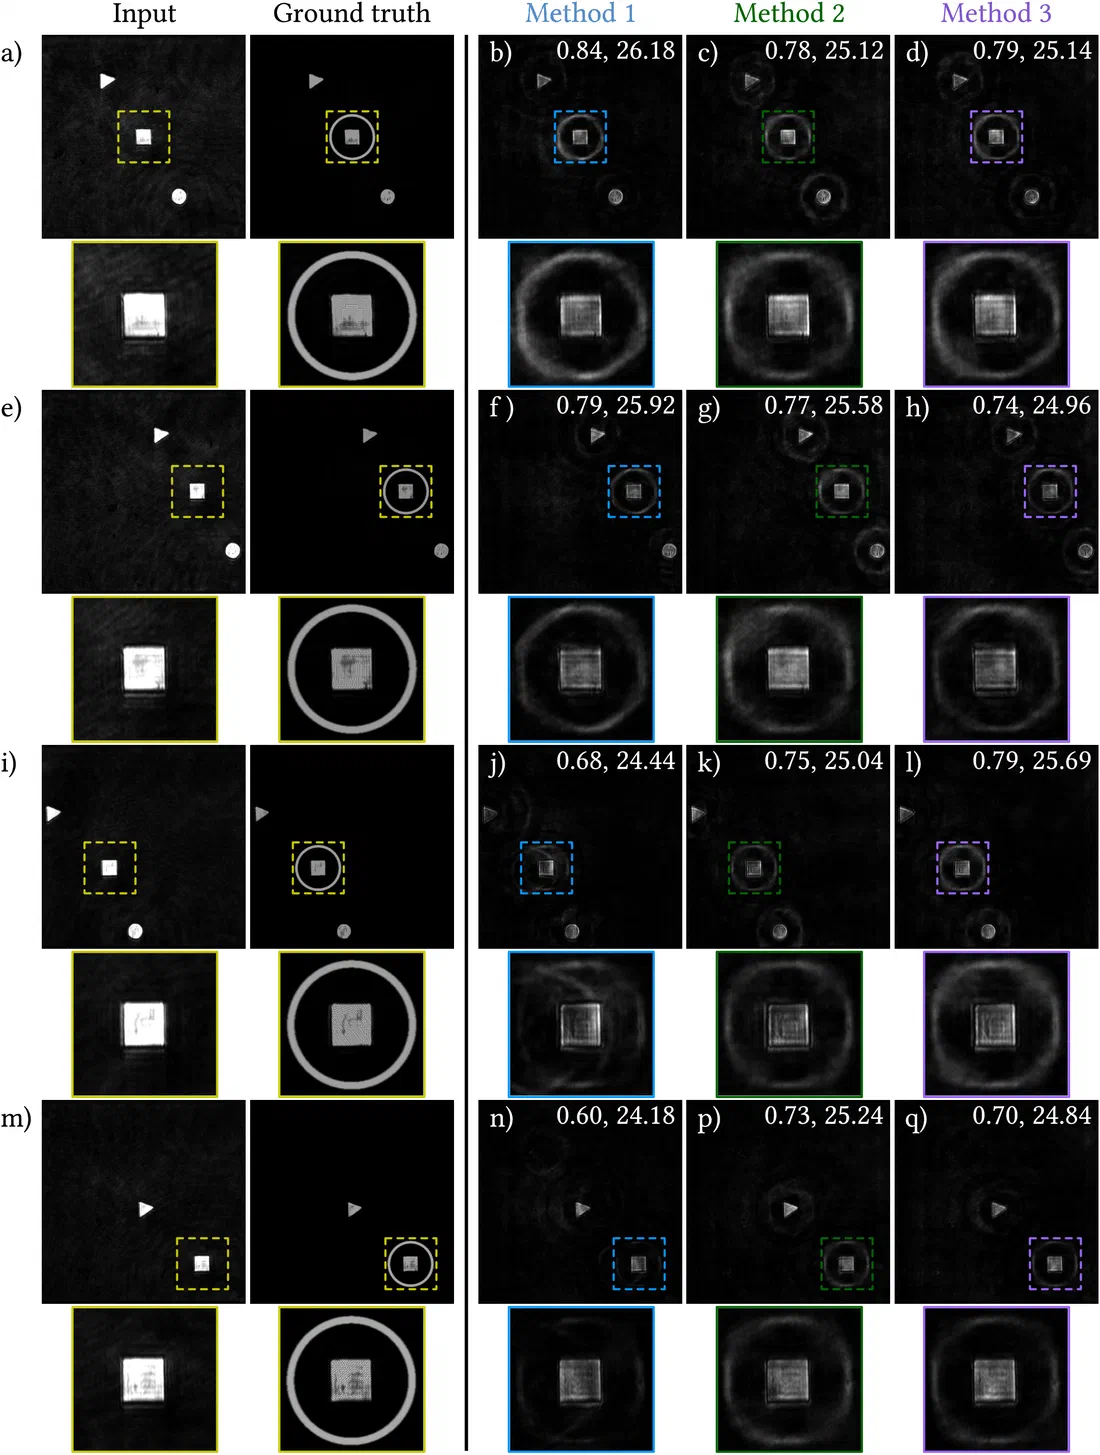
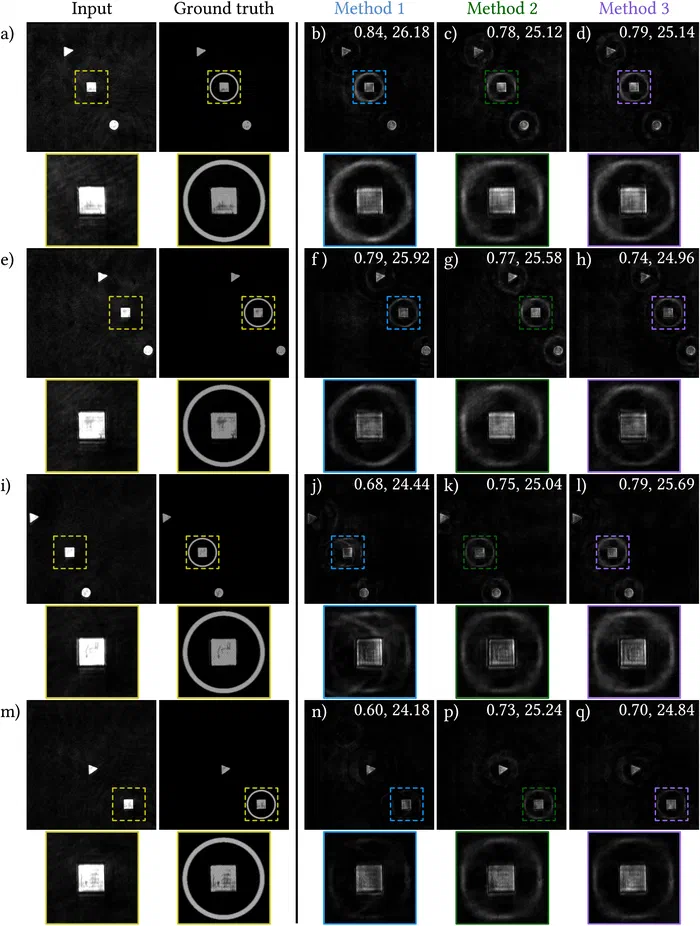
Instead of processing images on a computer afterwards, we let the optics do part of the work. An optimised phase pattern on a spatial light modulator highlights selected targets directly in the live view of a microscope.
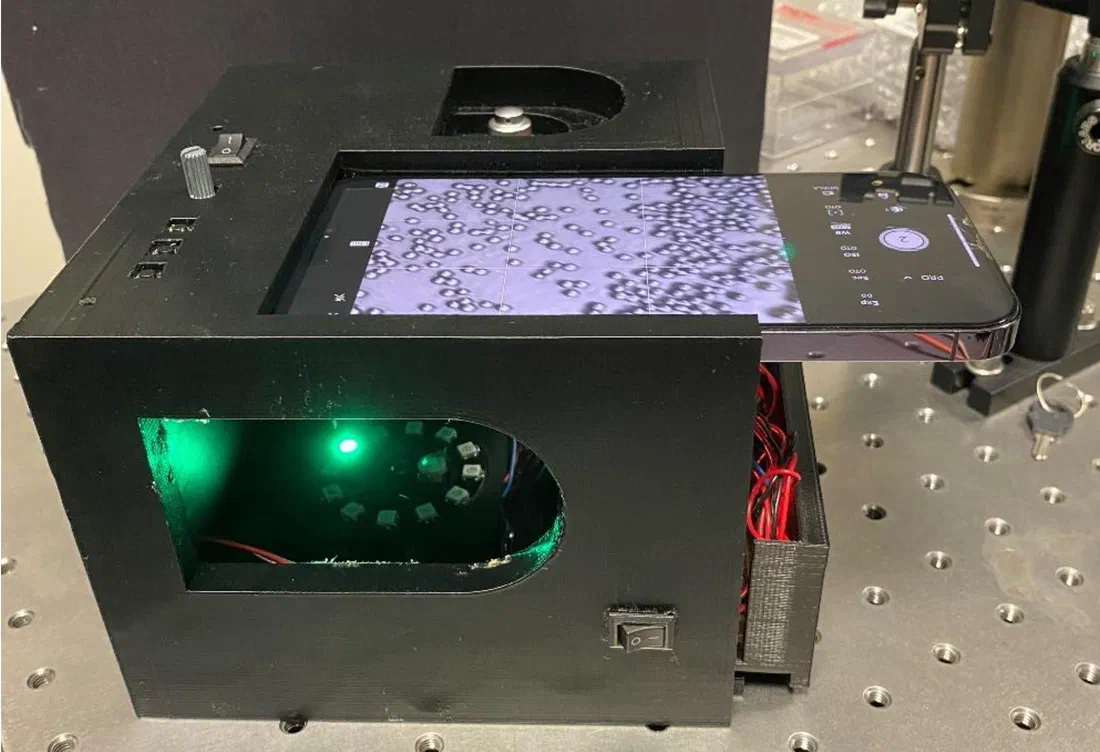
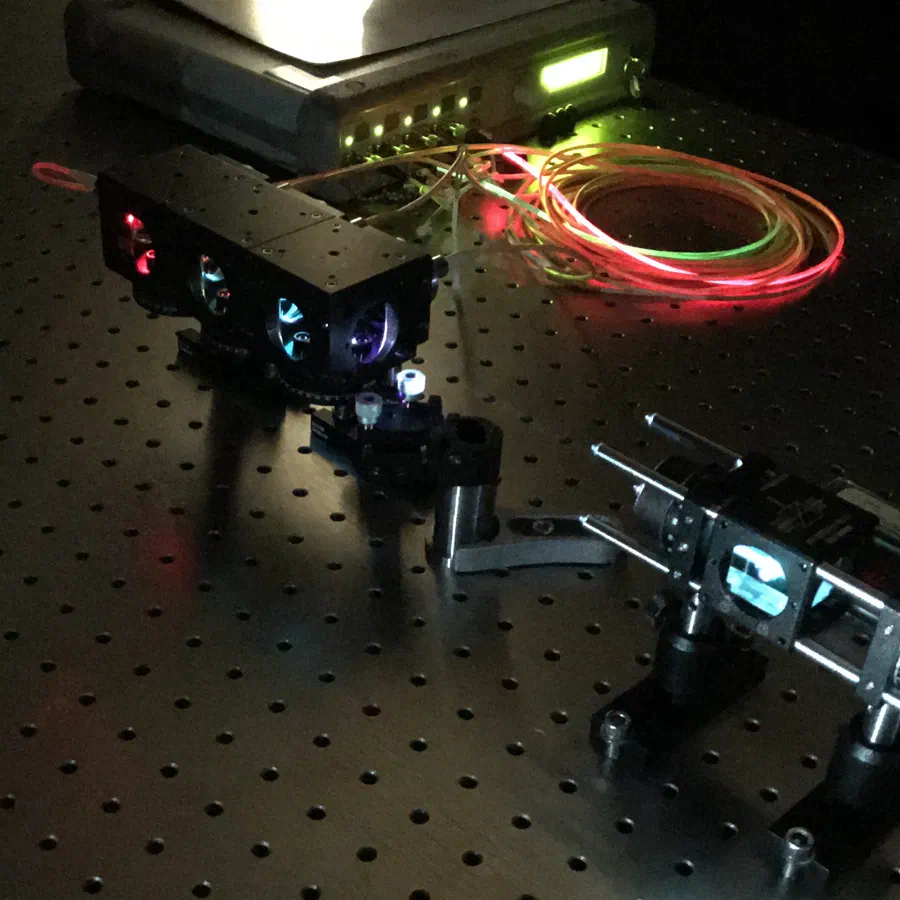
We design hardware that brings quantitative imaging closer to where it is needed, from incubator-integrated holographic imaging to compact spectrometers and microscope autofocus.
Five simulations, in the order we teach them: why the complex field beats an intensity image, how holographic microscopes are built, off-axis holography with numerical refocusing and aberration compensation, in-line holography and its twin image, and holotomography from an illumination scan.
An ordinary camera records intensity, so it only sees what absorbs light. Holography records the complex field: amplitude, which tells you about absorption, and phase, which tells you how much the light was delayed. Phase turns into thickness or height, so it images transparent cells and measures micro-optics and surfaces.
Specimen
1
Intensity image
What an ordinary camera records with incoherent light: intensity only. Transparent structures barely show.
2
Amplitude
The first half of the complex field. It falls where the specimen absorbs or reflects less light.
3
Phase
The second half: how much the specimen delays the light. Click to move the profile line.
4
Thickness or height in 3D
Drag to rotate. Transmission: t = φ λ / (2π Δn). Reflection: h = φ λ / 4π.
5
Line profile
Solid: measured from the phase. Dashed: the true specimen.
Loading the simulation…
How the complex field is recorded. Three typical holographic microscopes: a Mach–Zehnder interferometer for transmission, a Michelson for reflection, and a lens-free in-line set-up.
Set-up
1
Follow the light
Schematic, not to scale. Light flows along the beams; the object arm is shown in the accent colour.
2
On the camera
The hologram this set-up records. The next tabs show how to reconstruct it.
Loading the schematic…
A tilted reference beam separates the object wave from everything else in Fourier space. Filter it out, then refocus numerically and remove the objective’s aberrations, all after the fact.
Specimen
1
Record the hologram
The object wave interferes with a tilted reference beam. The sample’s phase bends the straight fringes.
2
Filter in Fourier space
The tilt separates the spectrum into a zero order and two side orders. Drag the circle, or focus it and use the arrow keys.
3
Read out the field
−ππ rad
Loading the simulation…
Gabor’s original, lens-free holography. It is simple and compact, but the camera loses the phase, and the missing phase returns as a twin image.
1
Record an in-line hologram
No separate reference beam: light that passes beside the object interferes with the light it scatters, so the camera sees diffraction rings.
2
Propagate back to the object
The camera records intensity only, so the reconstruction also contains the twin image: the conjugate wave, out of focus by twice the distance.
Loading the simulation…
One hologram cannot tell how far along the beam something sits. Scanning the illumination angle and combining the holograms in Fourier space recovers the third dimension.
1
Scan the illumination
The plane wave steps through normal incidence and two rings of directions (dots below). Its wavefronts lag behind where the cell slows the light. Drag to rotate, scroll to zoom.
2
Fill Fourier space
Each hologram gives one cap of the Ewald sphere (white), shifted by −kin. Overlapping caps glow brighter.
3
Reconstruct
A 3D inverse Fourier transform of the filled volume. Surfaces: cell outline and the dense droplets and nucleus. Sections: x–z and x–y slices.
Loading the 3D view…
1
Scan the illumination
A simulated cell with a nucleus and lipid droplets. The plane wave steps through normal incidence and two rings of directions (dots below). Drag to rotate.
2
Fill Fourier space
Each hologram gives one cap of the Ewald sphere, shifted by −kin; the current cap is white. Drag to rotate.
3
Reconstruct
A 3D inverse Fourier transform of the filled volume gives the refractive index. Top: the true cell; bottom: the reconstruction. Watch the two droplets separate in x–z.
Loading the simulation…
Recent publications
The latest journal articles from the lab. Names of lab members are underlined.
@article{oguz2026label,
  title={Label-free holotomographic imaging of brain myelin},
  author={Oguz, Tuba and Ayd{\i}n, Mehmet {\c{S}}erif and Kerman, Bilal Ersen and Toy, M Fatih},
  journal={Scientific Reports},
  year={2026},
  publisher={Nature Publishing Group UK London}
}
@article{hussein2026dual,
  title={Dual-shot polarization digital holographic microscopy with phase bias equalization for full-field Jones matrix imaging},
  author={Hussein, Mohammad MTR and Toy, M Fatih},
  journal={Biomedical Optics Express},
  volume={17},
  number={4},
  pages={1877--1896},
  year={2026},
  publisher={Optica Publishing Group}
}
We take PhD and MSc students from biomedical engineering, electrical engineering, physics and computer science. You will build optical setups on the bench and write the reconstruction code that turns their data into measurements.